Driven “Small to Medium Business”
UX Manager, UX Lead
Group: North America – Fuels
Devices: Desktop, Mobile
Team:
- 1 – 2 – UX Consultants
- 2 – 14 Developers
- 1 – 6 QA
- 1 – 4 Product Owners
- 1 – 2 Stakeholders
Duration:
- 4+ years
Challenges:
- How might an account manager/driver user activate their account more quickly (< 30 days from credit check)?
- How might an account manager user more easily get the Card to the driver (< 48 hours from receipt of the Card)
- How might a non-customer get pre-approved for more credit and more products?
- How might a user become more engaged with the app in ways that are not only paying a bill?
- How might a user be more aware of credit usage/upgrade opportunities?
- How might an administrator be enabled to subscribe to more products?
- How might a driver be more successful in fixing issues at merchants and stores?
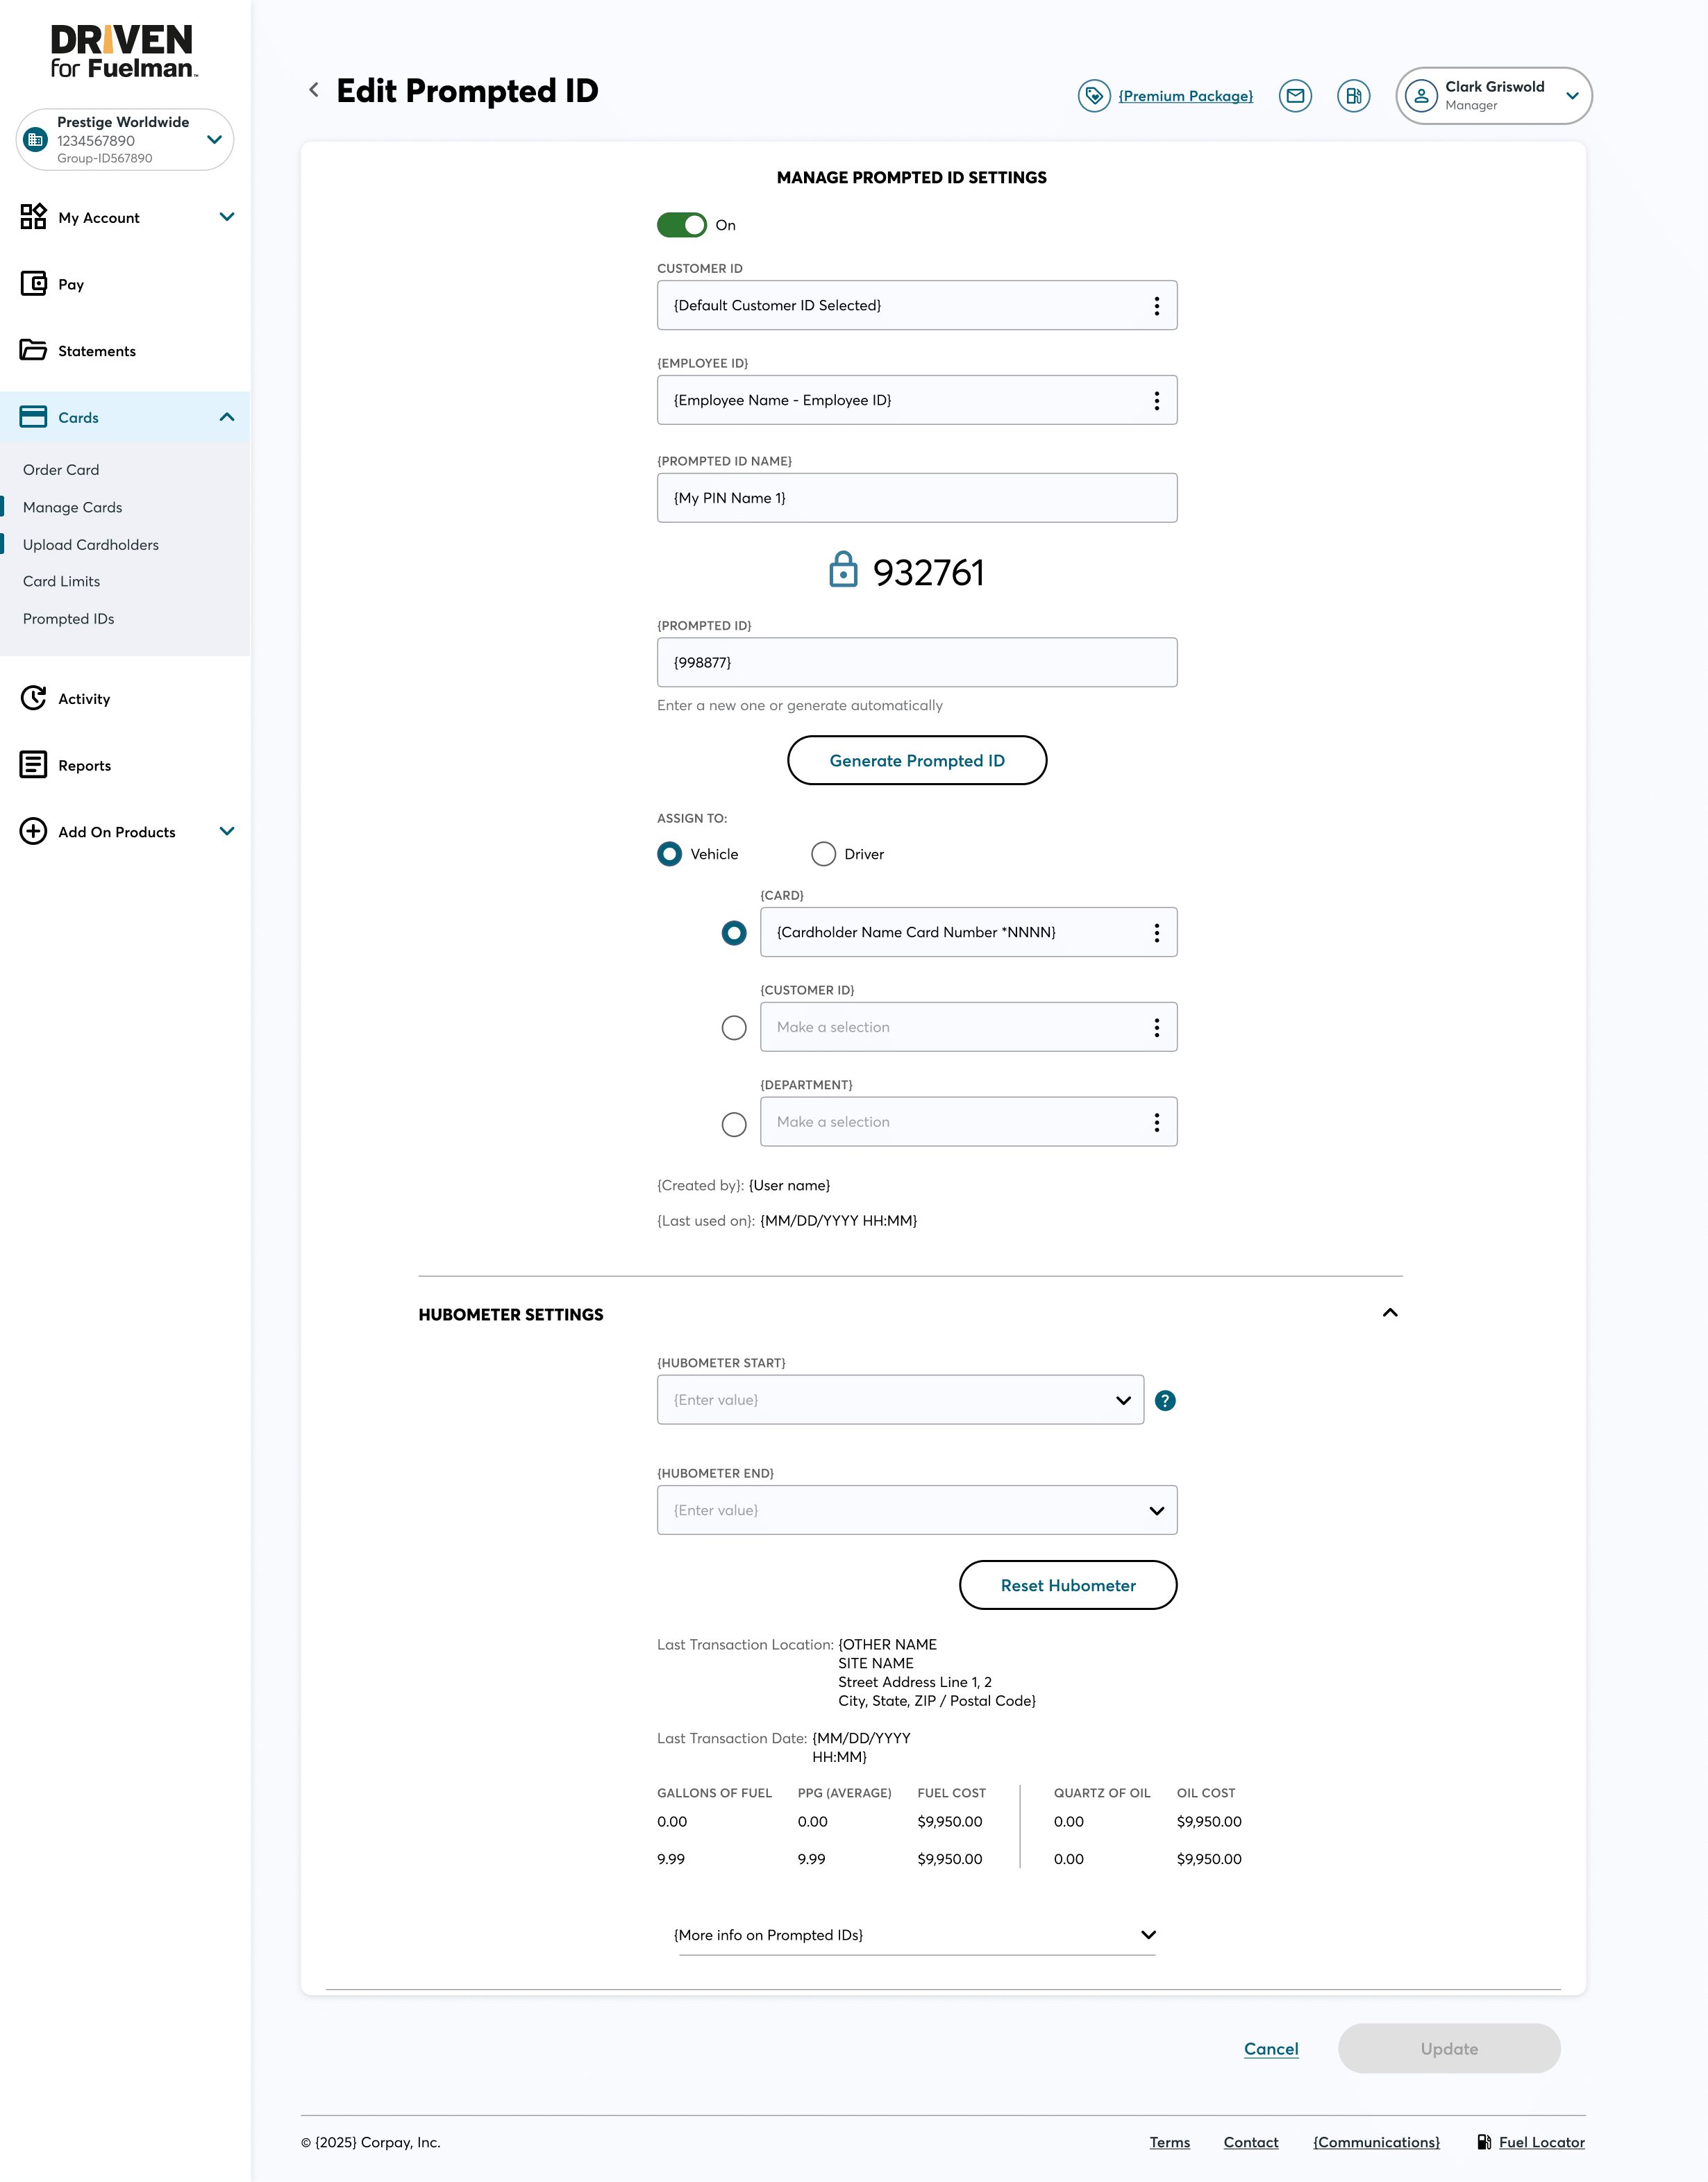
- How might a driver be more successful in managing their own Card and PIN numbers?
- How might an account holder better secure the card authorizations on their account?
- How might a cardholder more securely verify their card / account / plan, without needing to call customer support or their administrator?
Deliverables:
- ~2,200 wireframes / year (created, maintained)
- 150+ flow diagrams (users, systems) / year
- 211 UI component library
- 60+ UX consultations / year
- 50+ pages of annotations / year
- 12 research projects, 45 sessions / year – Interview scripts with multiple paths
- ~1,250+ responses / year – Online Surveys (Email, Web) with linear path
- 360+ responses / year – In-app feedback feature, linear
- Human analysis of data (raw data, system-generated data, video/audio, transcription)
- Interactive prototypes
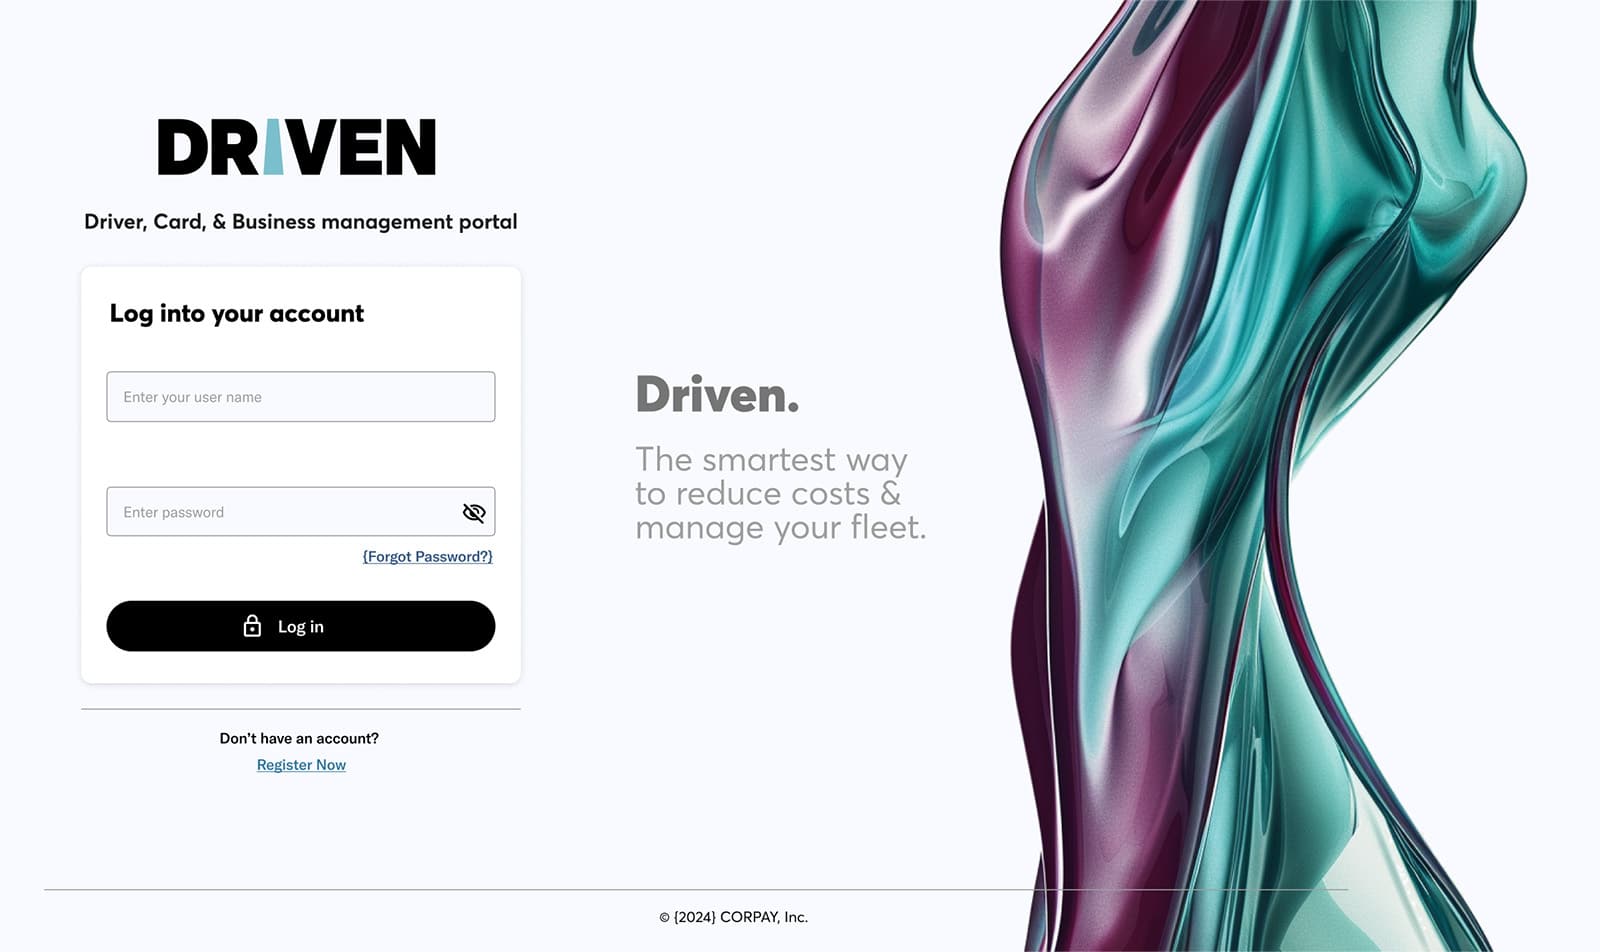
- Register / Sign Up / Account setup
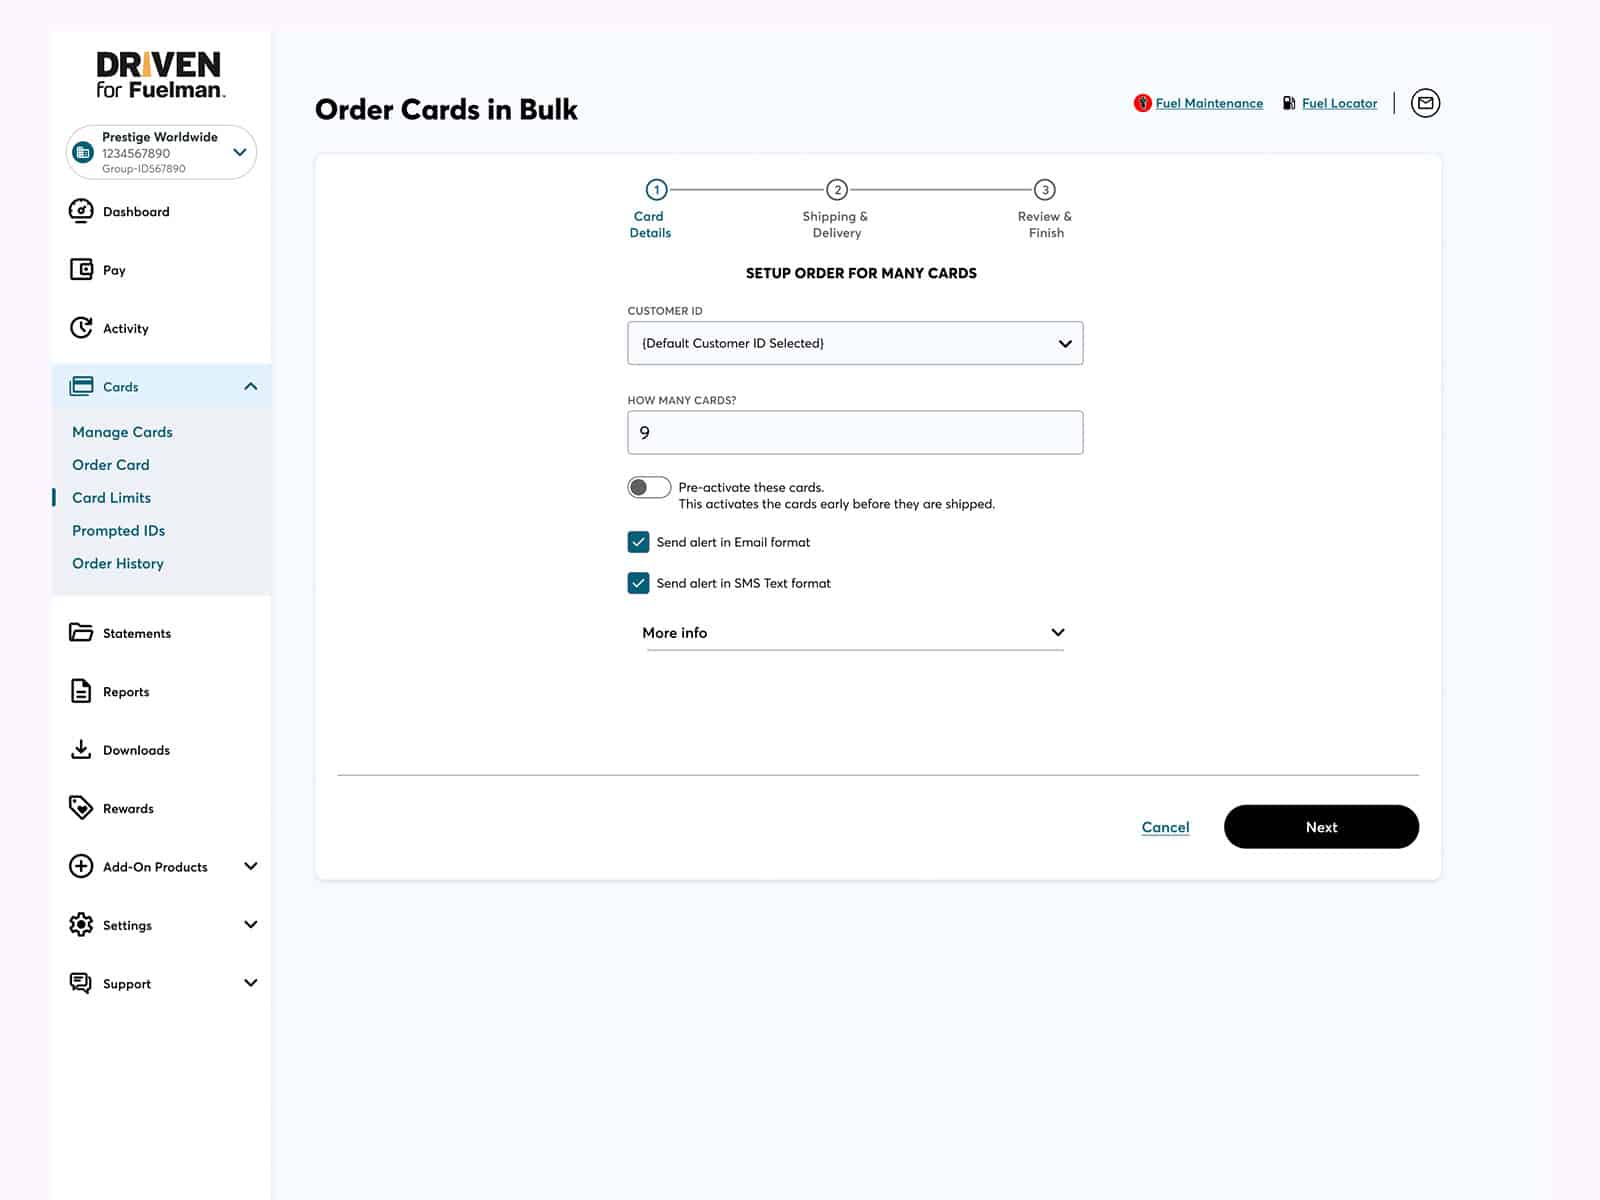
- Card order
- Card activations
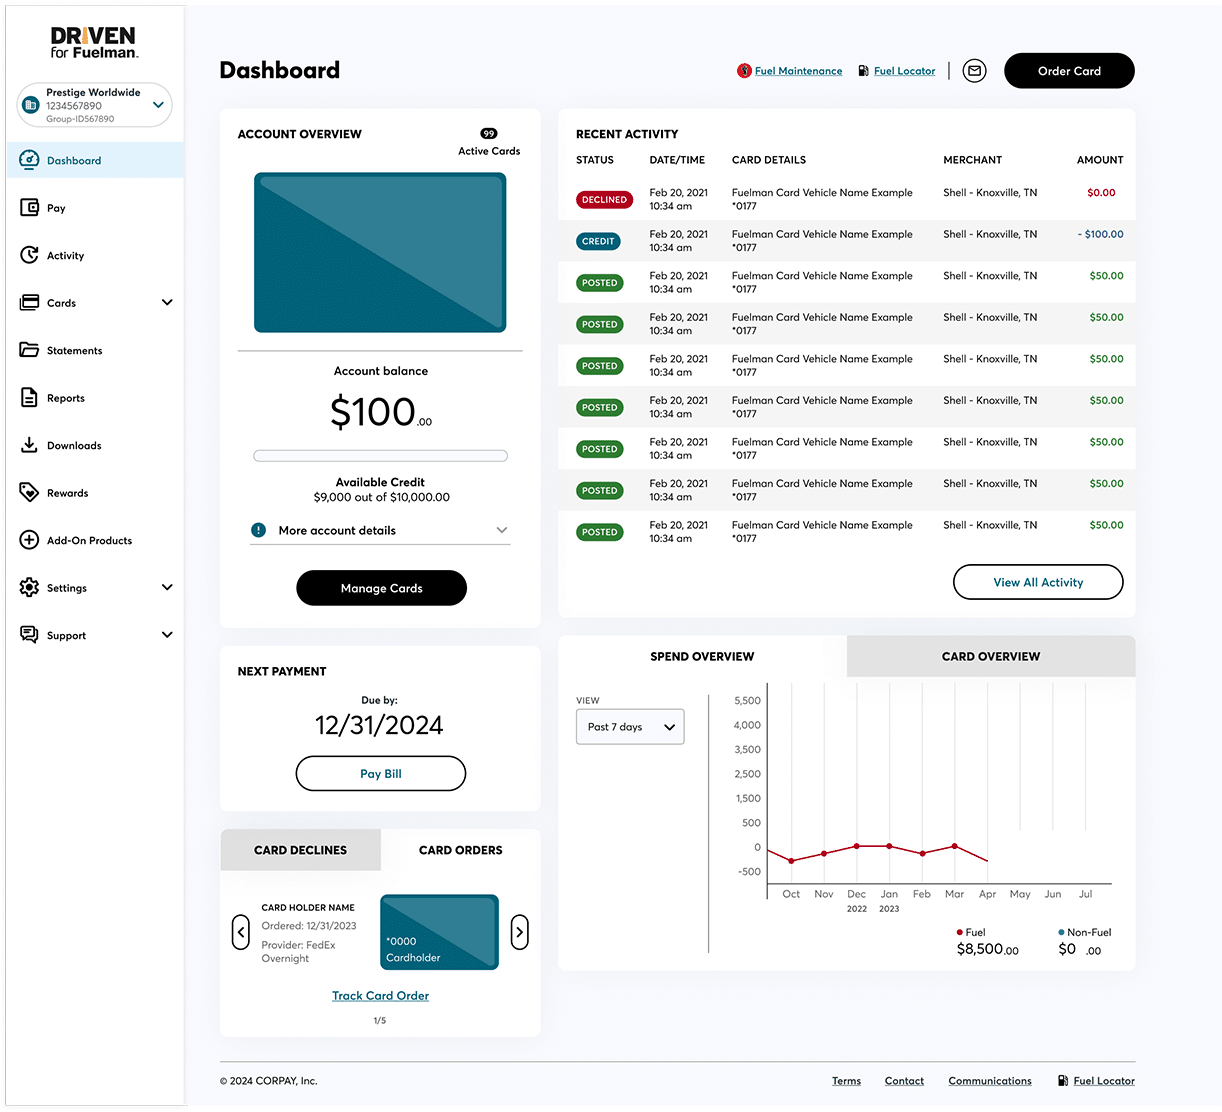
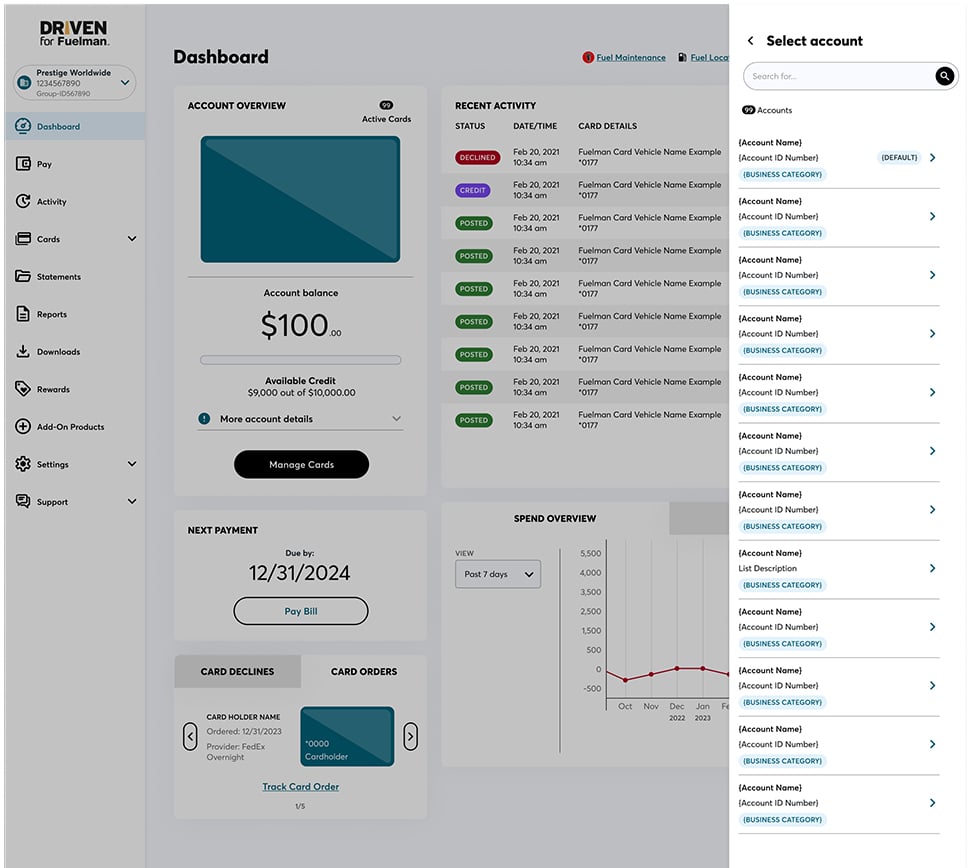
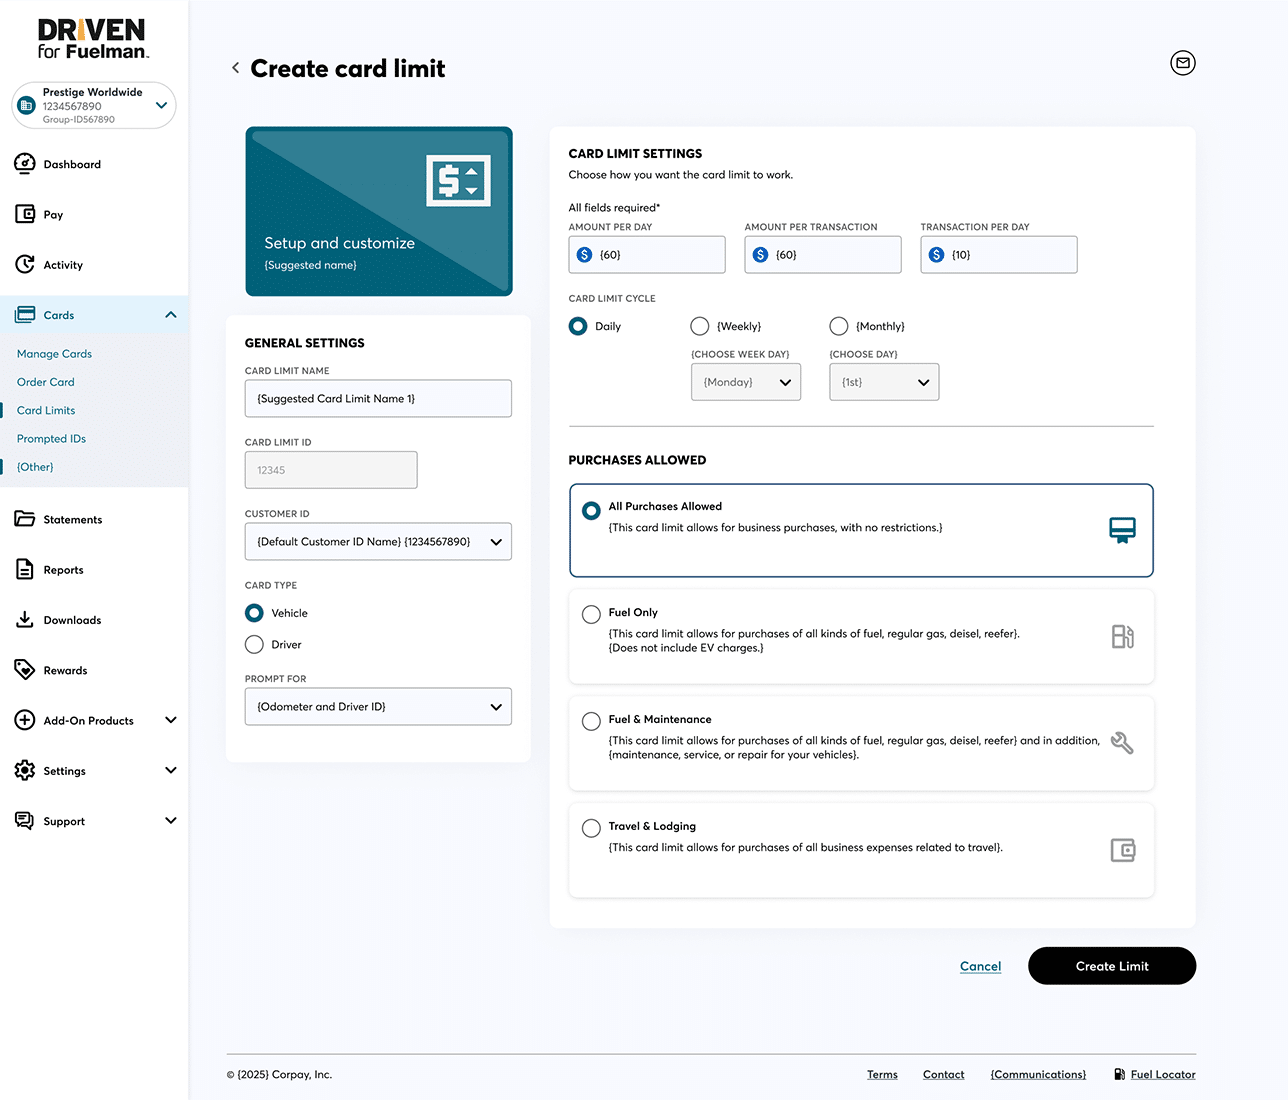
- Card management
- Upsell/Cross-Sell product interface
- Ride-along with Drivers
My contributions:
- Team lead – 99%
- Hiring / Team building – 90%
- Design Library creation – 80%
- Reporting / Presentations – 80%
- Creating interactive prototypes – 70%
- Reviewing / approving designs – 90%
- Interviewer – 50%
- Data analysis – 50%
- Promoting / Selling UX services – 30 – 50%
- Content Writer – 60%
My team, including my group’s VP, contributed in other amounts, in other collaborative and useful ways.
Measure:
- ~40 Human Interviews
- ~50 Listening to customer support calls
- 4 – 12 Sales, Customer support representative interviews
- Live product usage data
- Google Analytics, Adobe Target, SalesForce
Conditions:
- Team size, configuration, and various process changes
- UX team was moved to different groups 3x
- Limited budgets ($0 – $150,000 / annual)
- Various changes in senior leadership
- Some unconventional development practices (automation tests, reviews, UATs)
- Sub-standard development quality
- 1-4 Front-end UI Developers
- Above standard QA team
Results:
- +1.2% Card Order submissions – Estimated $1M+ annual revenue 2020 – 2022 – Driven web
- 70% – Reduced load time Driven web (7 sec to 2.5 sec) – 2024
- +3% – Increase in customer self-service of PINs 2022 – Driven web.
- +2% – Increase in customer self-service of Purchase Profiles – 2023 – Driven web
- +3.5 – Increase in customer self-service user/account provisioning – 2022 – Driven web
- +20% – Increased Card self-authorizations by customers between 2023 – 2024 – Driven network
- -9% – Reduced customer support call volume through self-service enhancements – Driven network
- +1.2 – Increase in visits per user, per month (from 1.5 to 2.7 visits) 2021 – Driven network
- 100%+ – Increase in user count up to (from ~5,000 to ~500,000 users) 2024 – Driven Network
Contact me for a demo.
